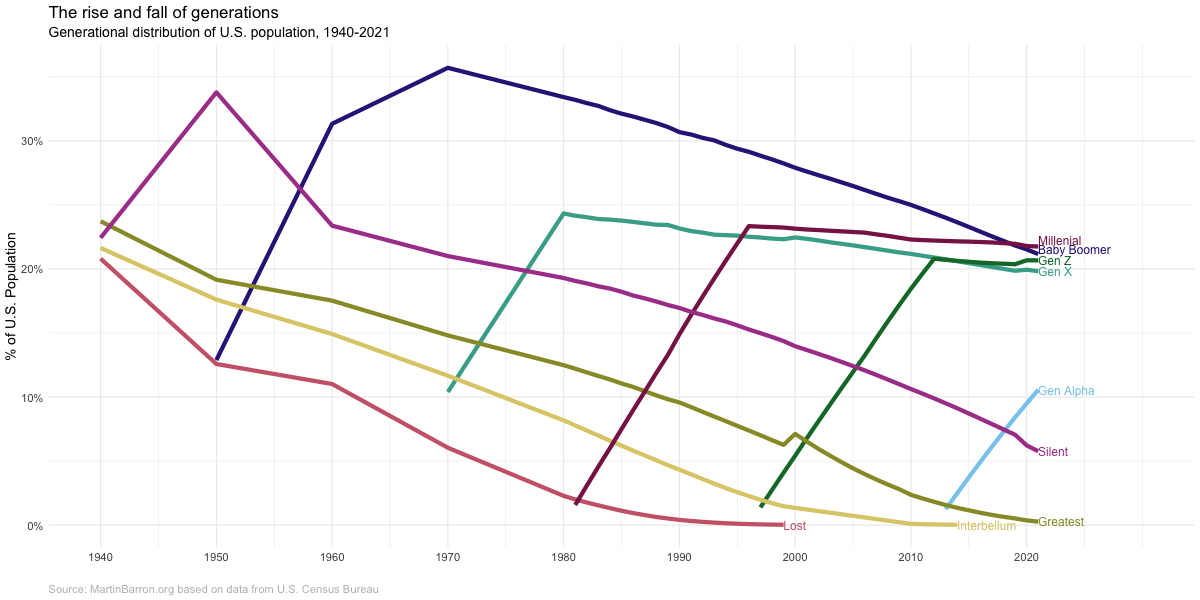
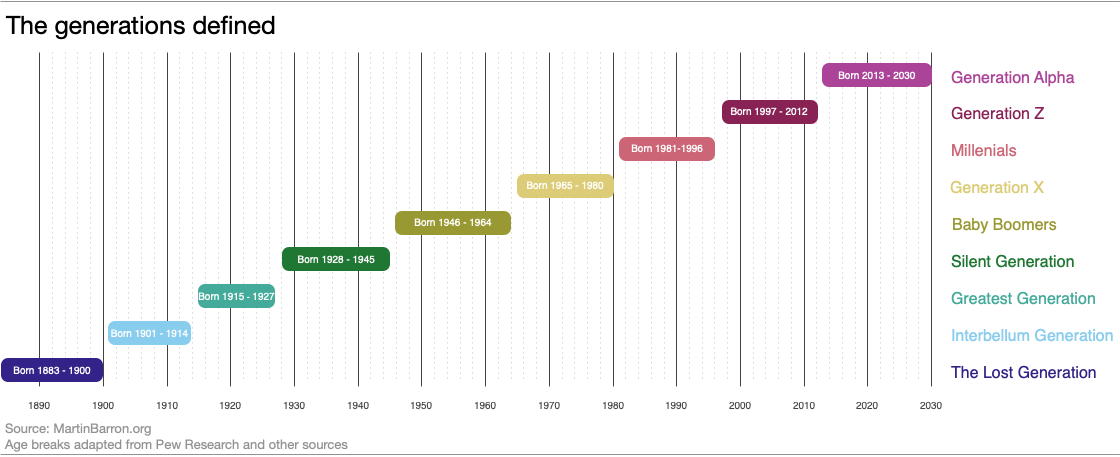
My previous post showing the definitions of different generations was in service of creating the chart below. This chart illustrates the “rise and fall” of generations across their lifecycle. As a new generation is born, it’s share of the population increases. Once a generations births have ended, there is a very long tail as people in that generation slowly die and new generations are born.
The data from the chart below comes from the U.S. Census bureau. I was able to use yearly population estimates from 1980 onward, but prior to 1980 the data comes from decennial Census PUMs data (hence why, for example, Gen X looks it starts in 1970–instead of 1965–and why the baby boomers have such an odd slope between 1960 and 1970). The Census Bureau does not publish birth year, so I estimated birth year (and thus generation) from age and year of estimate. There will thus ‘slop’ in my estimates but they should be close for my purpose here.