I’ve been fascinated by the potential of Github Copilot for quite some time now. I was so interested in playing with Copilot that, earlier this spring, I spent a fair bit of time learning to use Visual Studio Code and getting it set up for R development. And, while VS Code proved to not be especially to my liking (at least for R development and compared to RStudio), I was quickly enamored by my early experience with Copilot.
So when I saw this post pointing out that the development version of RStudio contained Copilot integration, I was very excited. I ignored all the big flashing “beware” signs that come along with a daily development build and downloaded it immediately.
While I’ve only been working with it a couple of days, I’m kinda in love. Here are some initial thoughts.
Setup
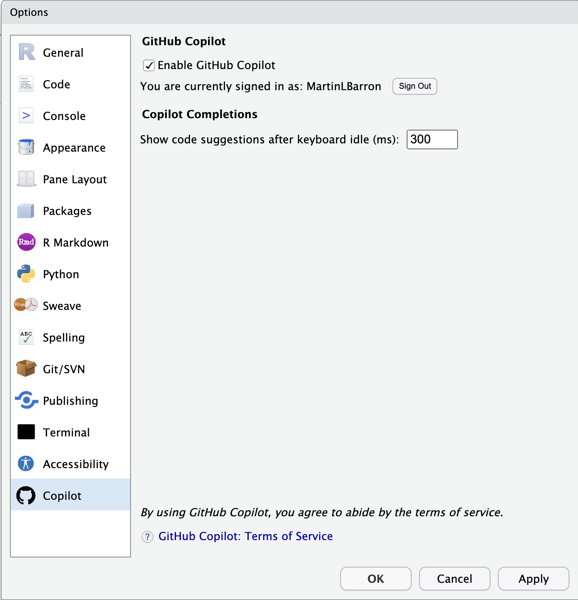
Setup is super easy. Simply open your global options (tool -> Global Options… -> Copilot) and enable it. You’ll need to sign into Copilot from RStudio, but that’s also just a simple process involving clicking a url, and entering the usage code presented1. One bug I stumbled across, in my limited experience, is that Rstudio’s not great at remembering that you’ve enabled Copilot. So you may find yourself having to turn it on again if you close and relaunch. But, daily build, beware, etc.
Usage
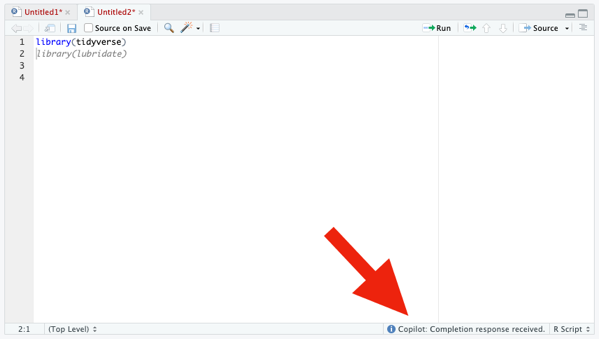
Once enabled, use of Copilot is very straightforward. Open an editor window; start typing. Copilot captures your code and suggest (through gray, italicized text). Like the selection? press tab to accept it. Don’t like it, simply continue typing (or press Esc) and the suggestion disappears.
If Copilot isn’t actively suggesting anything to you at the moment, the only visual indication that it’s running is some text in the lower right corner of the editor window. Otherwise, there are no visual differences to the interface.
From my experience with Copilot in VS Code, I know that it’s possible to have Copilot cycle through suggestions, if you don’t like the first. That appears to not be working yet in RStudio (or, at least, I couldn’t figure out how to trigger it). In VS Code (and other? IDEs) you can cycle using Option/Alt + ]. That does nothing, currently, in RStudio.
Code Suggestion
Of course, the whole point of Copilot is code completion and, more particularly, project-relevent code completion. So to do a minimal test, I need a project. So here’s the little toy task I set myself to try out Copilot: create a plot of drug crimes over time (relative to other crime types) for the city of Chicago. This is a really straight forward task with a few simple components:
- Download the public crimes data from the City of Chicago’s website.
- Explore the data to understand the variables and values of interest
- Perform any necessary cleaning
- Create my plot
As noted above, my first step is to just acquire the data from the City of Chicago’s public portal. Based on my previous experience with Copilot in VS Code, I knew Copilot offered reasonable suggestions based on comments, so I added:
# Read crime data from city of chicago websiteAnd it suggested:
crime <- read_csv("https://data.cityofchicago.org/api/views/ijzp-q8t2/rows.csv?accessType=DOWNLOAD")Which…is exactly—and frighteningly—correct. I wasn’t about to trust it blindly, but 10 seconds of Googling confirmed that ijzp-q8t2 is, indeed, the cumulative crimes data I was looking for. And just like that, I kinda fell in love with Copilot all over again.
EDA
…And then Copilot seemed to break. I typed (and typed) and it suggeted nothing. All I wanted to do for my exploratory data analysis was to look at the list of variables, find the crime type variable and explore its values, and find the date variable and figure out its format. So I typed the following and Copilot suggested nothing at all.
# Explore crime data
str(crime)

library(simplefreqs)
freq(crime$`Primary Type`)
length(levels(factor(crime$`Primary Type`)))
Again, daily build, beware, etc. etc. I restarted, confirmed Copilot was enabled, and went back to work.
Data Cleaning
…And so did Copilot. I typed :
# recode `Primary Type`
Df <- crime |>
    rename (
And it auto-suggested exactly what I was planning to do. It even recognized that I was using the native pipe character and anticipated—correctly—that I’d want to continue my pipeline:
# recode `Primary Type`
Df <- crime |>
    rename (primary_type = `Primary Type`) |>
So that’s what I did, I continued my pipeline by adding mutate ( and it autofilled the rest for me.
# recode `Primary Type`
df <- crime |>
     rename (primary_type = `Primary Type`) |>
     mutate(primary_type = fct_lump(primary_type, 10))
Here I was faced with a little bit of a question. I didn’t actually intend to lump my factor levels here. My original intention was to simply transform the variable into a factor with all levels intact. But, lumping here wasn’t a bad idea. It just wasn’t my original intention. So, do I stick with my original intention or follow Copilot? I choose to follow Copilot, with a twist (rather than selecting the 10 largest levels, I lumped all levels where the proportion of cases was below .5%).
I then noticed that the raw data actually already did some grouping and had an “OTHER OFFENSE” category. So I needed to combine it with my new “Other” category. I didn’t remember the forcats command to do this…and neither did Copilot. It suggested I fct_gather() ….which isn’t a valid forcats function! What I was looking for was fct_collapse() or fct_other(). I ended up doing it myself as it seemed to really confuse Copilot.
df <- crime |>
    rename (primary_type = `Primary Type`) |>
    mutate(primary_type = fct_lump_prop(primary_type, .005)) |>
    mutate(primary_type = fct_other(primary_type, drop=c('Other', "OTHER OFFENSE"), other_level="OTHER”))
Next up: date. Dates in this file are stored as character strings with format “MM/DD/YYYY HH:MM:SS AM/PM”. I wanted to transform this to a simple Date variable. I got to here:
# Recode Date to date variable
df <- df |>
and it filled in the rest:
df <- df |>
    mutate(date = as.Date(Date, format = "%m/%d/%Y”))
I can never remember my date formats so—trust but verify—a little googling was needed. It showed that the Copilot suggestion was exactly what I was looking for.
Initial Plotting
I started the next section with a comment. I got to # Plot and Copilot filled in the result # Plot crime by date. Maybe that would have been better “crime type”, but it seemed good enough so I accepted it. Copilot then immediately added a ggplot block at me
# Plot crime by date
df |>
  ggplot(aes(x=date)) +
  geom_freqpoly(aes(color=primary_type), binwidth=30) +
  scale_x_date(date_breaks = "1 month", date_labels = "%b %Y") +
  theme(axis.text.x = element_text(angle = 90, hjust = 1))
Now, I’ve never used geom_freqpoly—I had to google to see if it was real and what it did. It’s not what I was looking for but it’s not unreasonable, either. Here’s the plot it produced.
Not attractive, but in the ballpark. By binning to 30 days, we get rough monthly indicators and it appropriately scaled the axis to 1 month (though it mean the there were so many labels they were unreadable). It also is hard to tell what line is the narcotics line, which was my original goal—not that I’ve done anything to indicate that to Copilot.
Data Wrangling
I decided then to do some wrangling and get the data in shape to be plotted using geom_line. Specifically I wanted to truly summarize by month (not rely on a 30 day shorthand). So I needed to group the data by year, month, and primary type, summarize the counts, and then construct a new date variable indicating the aggregate month and year.
Copilot was moderately helpful here. To be honest, I knew what I needed to do and I just started typing. I kinda didn’t give Copilot much of a chance to chime in. Here’s what this chunk of code looked like.
# Prepare data for plotting
df <- df |>
  mutate(month=month(date), year=year(date)) |>
   group_by(year, month, primary_type) |>
  summarise(crime_count=n()) |>
  mutate(date=as.Date(paste(year, month, "01", sep="-"))) |>
  ungroup()
Final Plotting
Finally, with my data ready, I could create the plot I wanted. I was curious what it would do with a less well known package so I imported `gghighlight` and went to work. Here’s what Copilot suggested:
df |>
ggplot(aes(x=date, y=crime_count)) +
   geom_line(aes(color=primary_type)) +
   scale_x_date(date_breaks = "1 month", date_labels = "%b %Y") +
   theme(axis.text.x = element_text(angle = 90, hjust = 1)) +
   gghighlight(max(crime_count) > 1000)
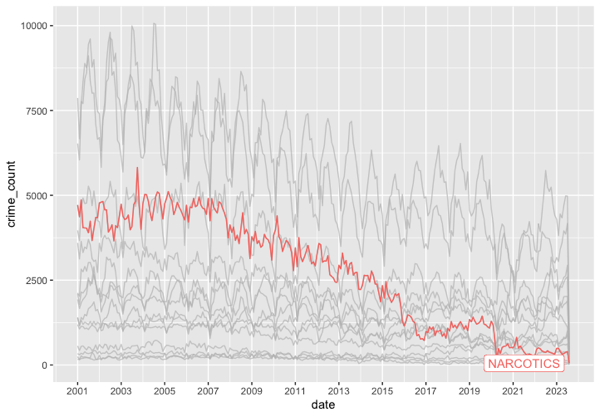
It guessed—correctly—that I wanted to use geom_line and that I wanted to use gghighlight. It didn’t get my intentions exactly right on gghighlight, but why would it. Here’s my final edits and the resulting graph. Drug crimes have basically bottomed out after a (slower) two decade decline.
df |>
ggplot(aes(x=date, y=crime_count)) +
    geom_line(aes(color=primary_type)) +
    scale_x_date(date_breaks = "2 year", date_labels = "%Y") +
    gghighlight(primary_type == “NARCOTICS")
Conclusion
Copilot isn’t perfect. But, wow. I’m impressed by it. More often than not, it knows exactly (or really closely) my intent and is able to give me some really useful starter code. I could easily see this becoming as indispensable to my coding as color coded syntax?
A few months back I gave an internal talk where I made some predictions for the future of analysis/data science. One of those was predictions was that my entire team would all be using something like Github Copilot before the end of the year. Having seen Copilot in action in RStudio, I’m more sure of this prediction than ever.
Postscript
There’s no real reason to look at it, but I posted the entire file of code generated above to Github. I needed to add a simple readme, so I created a blank text file, added “# Copilot RStudio Experiment” and it autofilled the following.
This is a simple experiment to test the capabilities of GitHub Copilot. The goal is to create a simple R script that will read in a CSV file, perform some basic data cleaning, and then create a plot.- This assumes you’re already signed up for Copilot and logged into Github. ↩︎
