Over the next few weeks[efn_note]Let’s be honest, over the next few months/years is more likely.[/efn_note] I’ll be posting an deep-dive data analysis of Fugazi’s live performance history. Why? Why not. All the data is there and I was bored.
I probably saw Fugazi perform a dozen times. Attending college outside of DC during the early ’90s made it easy. They played a lot, and famously never charged more than $5 for a show (and most of the time I saw them the show was free). I saw them in small venues and big indoor and in the shadow of the Washington monument. And they were never boring.
Since 2011, Fugazi has made recordings of their shows available for download at https://www.dischord.com/fugazi_live_series. To date, playlists and recordings have been posted for 895 (85.4%) of all their shows. Across their entire career, Fugazi played 23,201 songs. In future blog posts, I’m going to analyze those performances. Again, for absolutely no good reason.
Color palette
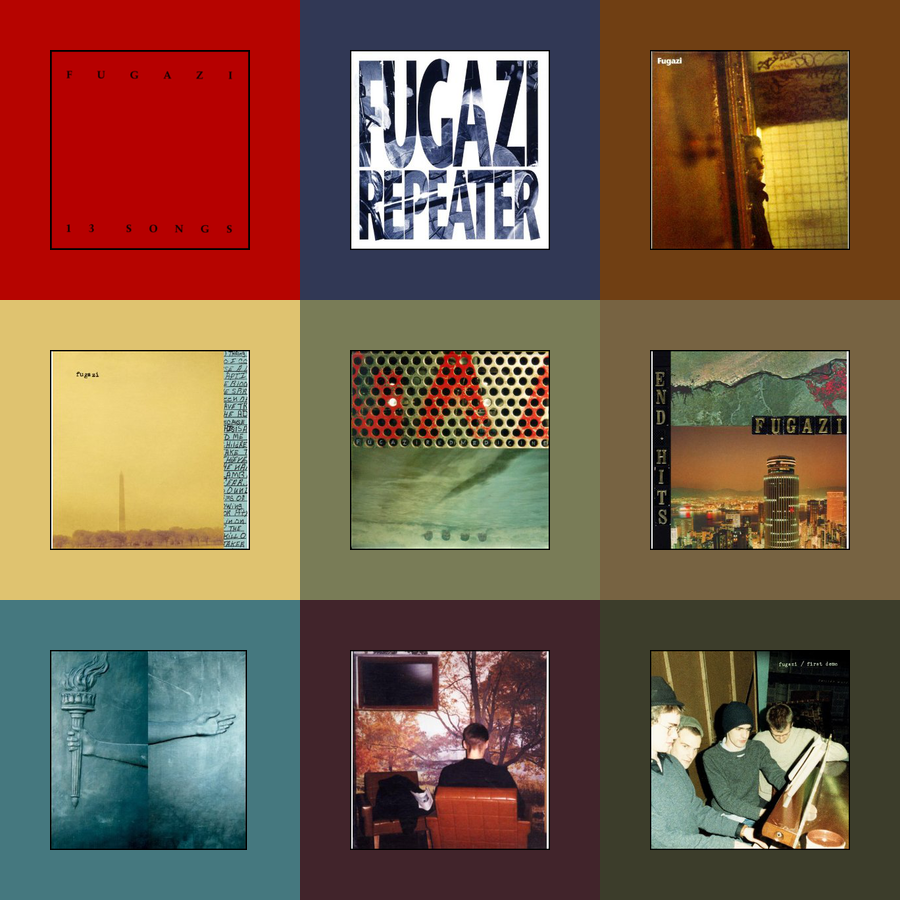
One idea that I had for the analysis was to use the dominant album colors for the visualizations. I’m not sure that’s actually going to work because several of the albums used very similar palletes (they certainly seemed to have liked their olivey greens). But it resulted in a kinda cool image, nonetheless.

I’m not sure why anyone would need or want it, but here’s my “Fugazi album color pallete” for reference.
cols <- c("13 Songs" = "#B60400",
          "Repeater + 3 Songs" = "#313855",
          "Steady Diet of Nothing" = "#703F13",
          "In on the Kill Taker" = "#DFC370",
          "Red Medicine" = "#797C57",
          "End Hits" = "#776342",
          "The Argument" = "#45787F",
          "Furniture" = "#41242B",
          "First Demo" = "#3C3D2B")