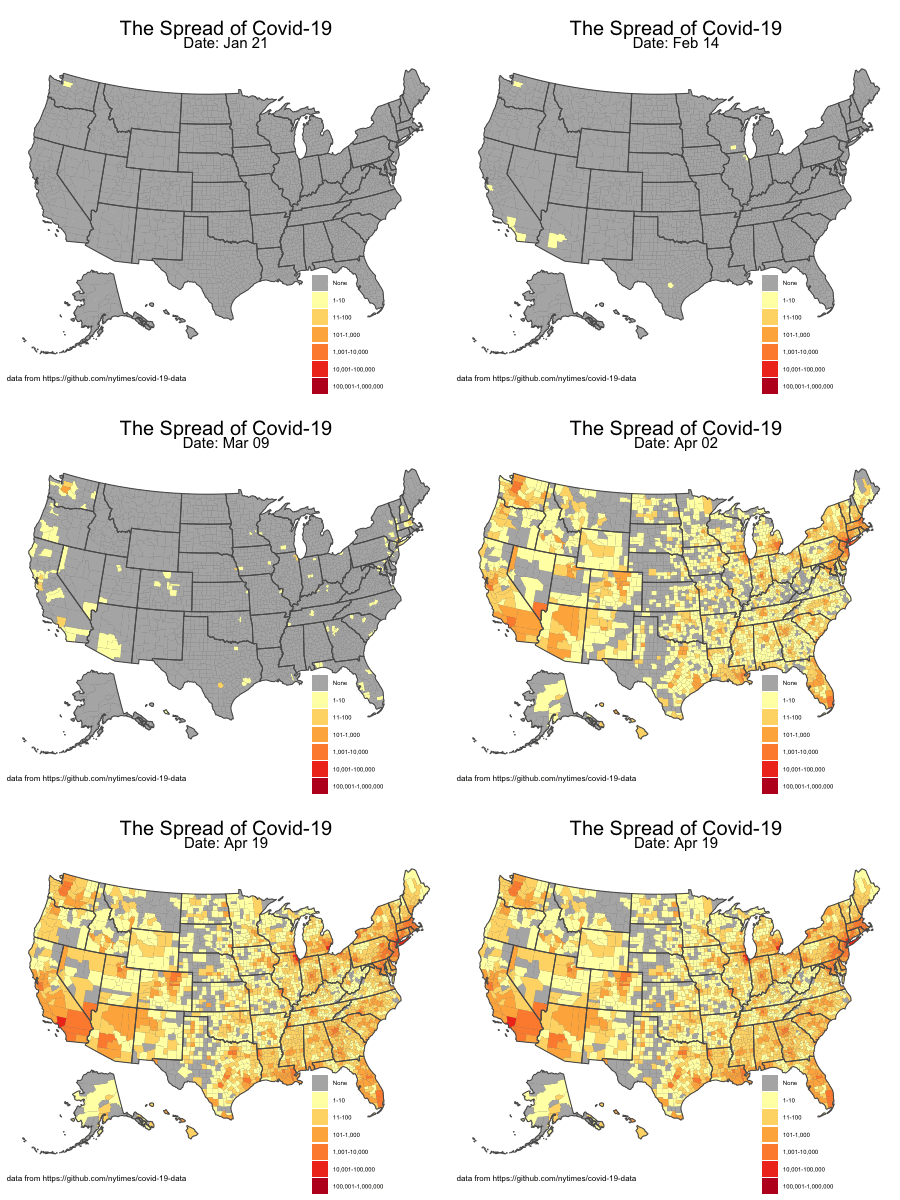
I’ve been playing with a R package called gganimate and created a simple animation showing the spread of Covid-19 through April 19th.

One dumb thought at a time
I’ve been playing with a R package called gganimate and created a simple animation showing the spread of Covid-19 through April 19th.

© 2024 Overthinking it
Theme by Anders Noren — Up ↑